
Bitcoin Breaks Above 365-Day Average, Bullish Signal or Trap?
Baca dalam 60 detik
- Harga Bitcoin akhirnya melewati moving average 365 hari setelah 310 hari terbenam di bawahnya, memicu spekulasi reli lanjutan.
- Data historis Altcoin Pro menunjukkan penguatan 12 bulan setelah sinyal serupa, namun dua kegagalan pada 2018 dan 2022 menjadi catatan penting.
- Bagi investor Indonesia, sinyal ini bisa jadi acuan, tetapi tanpa regulasi jelas dan likuiditas terbatas, risiko volatilitas tetap tinggi.
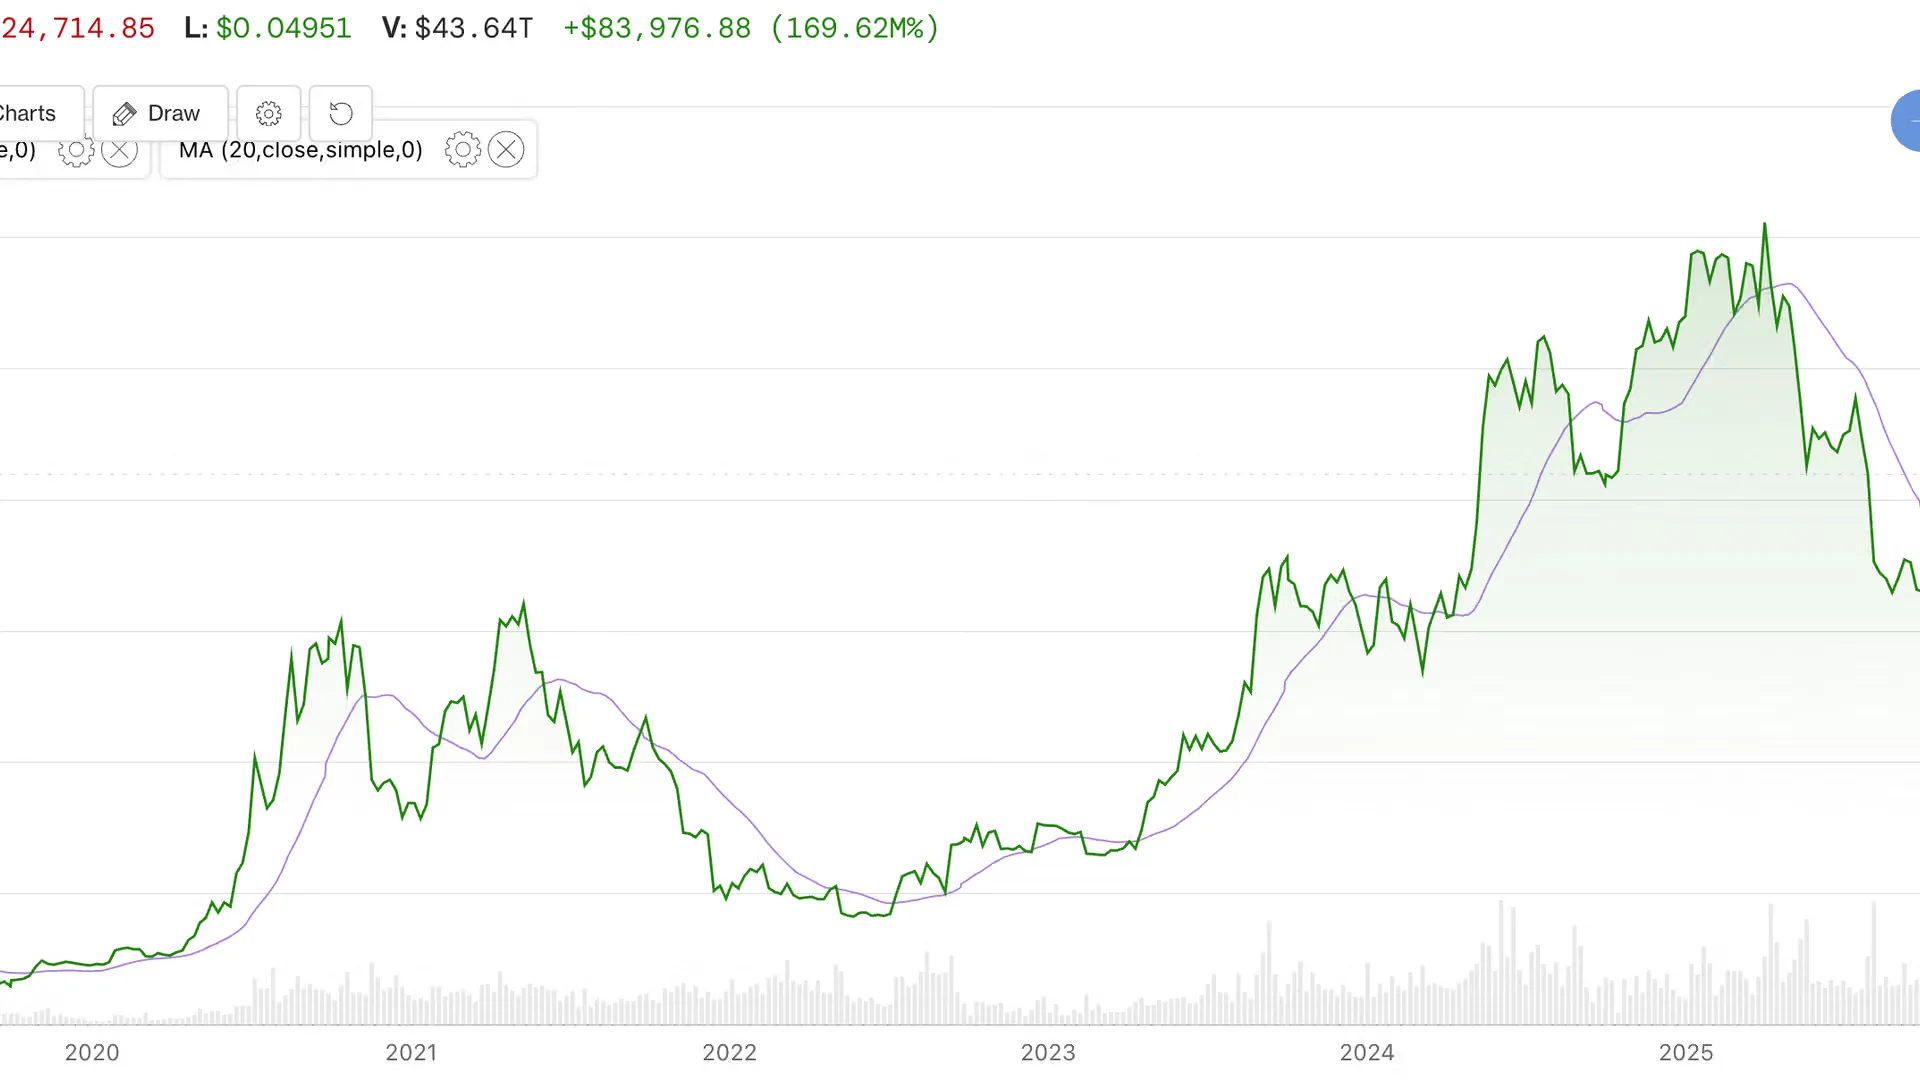
The price of Bitcoin (BTC) has drawn attention again after it managed to surpass its 365-day simple moving average (SMA) for the first time in 310 days. On 22 September, the largest cryptocurrency broke through the level of around US$80,900, sparking hopes of a bigger rally. This signal is considered important because Bitcoin had previously been trapped below that line for a long time.
According to Ryan Horst and Joni Zhuleku, founders of Altcoin Pro, in communication via email, this breakout is not without precedent. They noted five previous instances in which Bitcoin returned above its 365-day SMA after spending at least 90 days below it. As a result, over the following 12 months, the price was always higher, with gains ranging from 59% to more than 1,400%. However, the largest surge occurred in 2012, when Bitcoin was still a fringe asset.
Even so, Horst cautioned that this pattern does not always work. When Altcoin Pro included periods below the line that were shorter, they found two failed breakouts, in July 2018 and March 2022. In both cases, Bitcoin instead plunged around 27% and 59% within 90 days. "This September move is encouraging, especially after 310 days below the line, but we want to see it hold. This is a signal, not a guarantee," Horst said.
Altcoin Pro remains bullish for the long term, but its view depends more on the price position above the 200-day SMA than on the 365-day SMA. "The 365-day SMA is still catching up to something the 200-day SMA signaled in mid-August," they said. The 200-day SMA has risen to around US$70,800, with Bitcoin about 19% above it before a small correction in the last 36 hours. By contrast, the 365-day SMA is still declining and closer to the market price.
Moving averages are based on past prices, so they show how an asset traded over a given period, not where it is headed next. The 365-day SMA responds to changes more slowly than the 200-day SMA. "The 365-day SMA tells you where Bitcoin was six months ago. The 200-day SMA reacts about three months earlier. In a market that moves like this, three months is everything," Ryan and Joni Zhuleku explained.
In addition, on 8 September, Bitcoin's 50-day SMA crossed above its 200-day SMA, forming what is called a golden cross. This signal has a mixed track record as a standalone predictor, with several previous crosses failing to produce a sustained rally, wrote Omkar Godbole of CoinDesk. Altcoin Pro argues that this golden cross is more constructive because it appeared after a long period below the 200-day SMA, rather than near a market peak. Bitcoin spent 293 days below that measure before returning above it, shorter than the roughly 436 days in the 2022-2023 bear market.
"This is a signal, not a guarantee," Horst stressed.
For Indonesian investors, this technical signal can be a consideration, but it needs to be examined carefully. The domestic crypto market still faces regulatory challenges and thinner liquidity than global exchanges. Nevertheless, interest in digital assets continues to grow, especially among millennials and Gen Z. The Financial Services Authority (OJK) has regulated crypto trading through Bappebti, but a comprehensive legal framework is still in progress. High volatility is the main risk, especially if this bullish signal fails to hold.
Going forward, the next test is whether the small correction will push Bitcoin back to its 365-day SMA level. If the price can hold above it, the rally may continue. However, if it fails, the history of 2018 and 2022 could repeat itself. Investors are advised not to rely on a single indicator, but to combine technical and fundamental analysis, and to consider their own risk profiles.