
Bitcoin Posts Best Three-Month Streak Since 2012: Bull Run Signal or Bull Trap?
Baca dalam 60 detik
- Bitcoin menorehkan kenaikan tiga bulan beruntun (Juli, Agustus, September) untuk pertama kalinya sejak 2012, dengan total gain signifikan.
- Pola serupa pada 2012 diikuti reli 2.000% hingga April 2013, namun struktur pasar kini jauh berbeda dengan dominasi institusi dan likuiditas derivatif.
- Aliran dana ke ETF spot AS mencapai $5,5 miliar sejak Agustus, tetapi kebijakan suku bunga The Fed menjadi penentu utama keberlanjutan momentum.
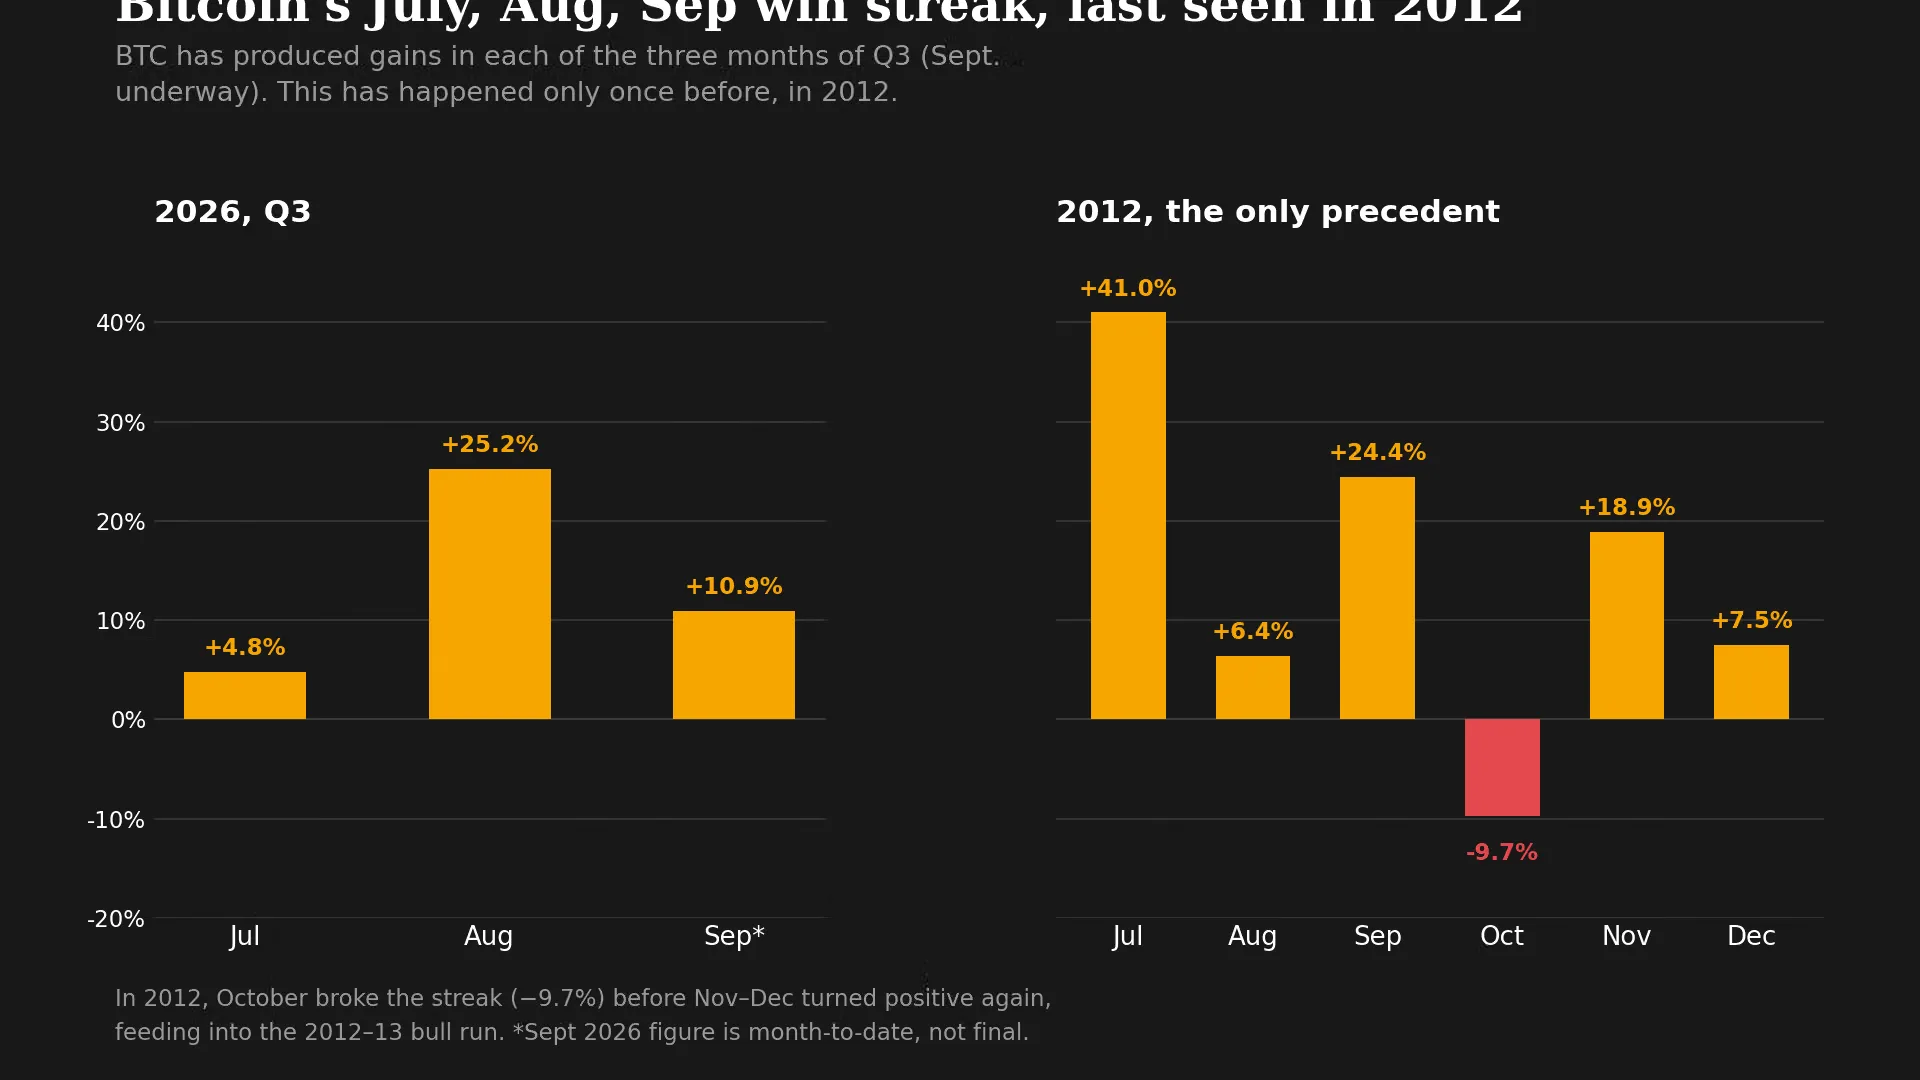
Bitcoin notched price gains for three consecutive months in July, August, and September 2026 — a phenomenon that has occurred only once in the cryptocurrency's history, in 2012. CoinDesk data shows Bitcoin rose 4.8% in July, surged 25.2% in August, and was still up 10.9% in September, around $86,140. The achievement has sparked speculation over whether the market is entering an aggressive bull run or nearing a saturation point.
In 2012, after three green months (41%, 6.4%, and 24.4%), October closed red with a 9.7% decline. But from a low of $10.17 on October 26, 2012, Bitcoin soared more than 2,000% over 165 days to reach $230 in April 2013. That pattern is now a reference point for some analysts, though the tiny sample size makes generalization risky. "History does not repeat, but it often rhymes," Nicolai Sondergaard, a senior analyst at Nansen, told CoinDesk, adding that Bitcoin's four-year cycle remains a framework the market watches.
The fundamental difference lies in market structure. In 2012, Bitcoin was a thin asset with a capitalization below $10 and could be moved by a handful of buyers. Today, Bitcoin is a global asset class worth trillions of dollars, with participation from large institutions, deep spot and derivatives liquidity, and a range of strategies such as options, futures, and basis trades. "A rally of more than 2,000% like the one after 2012 cannot be a reasonable expectation for 2026," said Vikram Subburaj, CEO of Indian exchange Giottus. According to him, the main change is in market structure: the 2012 rise began from a market that could be moved by a small group of buyers, whereas 2026 depends on whether large pools of capital keep allocating funds after the easiest gains have been made.
Institutional interest is again visible in inflows into U.S.-listed spot Bitcoin ETFs. Since August, these products have attracted more than $5.5 billion in investor funds, according to SoSoValue data. "The durability of those allocations matters more," Subburaj said. Lacie Zhang, head of research at Bitget Wallet, said the significance of this historical pattern lies more in its driver: institutional flows into ETFs that can continue to absorb supply in the fourth quarter even as the short squeeze fades. However, she warned that macro conditions remain the main counterweight. "The Fed raised rates to 3.75%–4.00% and signaled further hikes this year. Whether spot inflows stay positive after the squeeze fades will be a more useful durability signal than the calendar pattern itself," she said.
For Indonesian investors, this phenomenon offers important lessons. The domestic crypto market is increasingly connected to global liquidity, so Bitcoin's moves in the U.S. quickly spill over to local exchanges such as Indodax and Pintu. Indonesia's crypto asset regulation, which has been under the OJK since 2025, also opens opportunities for more structured crypto-based investment products, though volatility risk remains high. A stronger rupiah against the U.S. dollar can affect local investors' purchasing power, while Fed rate hikes could strengthen the dollar and weigh on risk assets, including crypto.
Looking ahead, the question is not just whether October will be red or green, but whether institutional flows into ETFs can hold up amid macro uncertainty. If inflows remain positive, the bull run narrative may continue. But if the Fed raises rates again, a healthy correction could be the more realistic scenario. The market will test how deep any correction goes and whether it becomes a new entry point or the start of a downtrend.